Containerized Real-Time Web Chat Application Monitoring Using Kubernetes, Prometheus and Grafana
INTRODUCTION
Modern real-time applications require low latency, high resilience, and continuous observability under varying workloads.
This project demonstrates the complete containerized lifecycle of a real-time chat application, covering dockerization, orchestration, monitoring, and performance evaluation using Docker, Kubernetes (Minikube), Prometheus, and Grafana.
The system follows a multi-container architecture consisting of a React-based frontend, an Express.js backend, a simulator container for generating baseline chat traffic, and an integrated monitoring stack. The initial implementation utilized Docker Compose to establish inter-container communication, service dependency management, and automated recovery from process failures.
The deployment was later migrated to a Kubernetes cluster running on Minikube to leverage features such as automated scaling, service discovery, and load balancing.
Monitoring and observability were enhanced using the Prometheus Operator deployed through Helm, providing comprehensive metric collection with components like kube-state-metrics and metrics-server.
Collected metrics were visualized through Grafana dashboards to analyze system performance and resource utilization in real time.
Performance testing was conducted using Apache Benchmark (ab) to evaluate backend throughput, latency, and scalability under different replica and resource configurations.
The project effectively integrates core DevOps concepts of containerization, orchestration, monitoring, and performance optimization in a cohesive and technically robust environment.
OBJECTIVES
Part 1: Containerization and Resilience
- Containerized frontend and backend: Build independent Docker images for consistent and portable application environments.
- Service orchestration with Docker Compose: Define a multi-container setup, networking, and inter-service dependencies.
- Restart policy configuration: Apply
restart:alwaysto ensure automatic recovery after container or process failure. - Resilience validation: Simulate backend failure to verify Compose’s self-healing restart mechanism.
- Recovery verification: Confirmed backend reconnection via
watch docker ps.
Part 2: Kubernetes Deployment and Automation
- Automated setup: Create a shell script to start Minikube, enable the
metrics-server, and build Docker images internally. - Namespace configuration: Deploy all application components within an isolated
chat-appnamespace for logical separation. - Deployments for Pod lifecycle: Use Kubernetes Deployments for replica control and rolling updates of backend and frontend Pods.
- Service networking: Configure ClusterIP services for internal communication and NodePort for external access via Minikube.
- Helm integration: Install Prometheus Operator using Helm for streamlined monitoring stack deployment.
- Startup synchronization: Verify Pod readiness and launched a background
minikube tunnelfor stable external routing.
Part 3: Monitoring, Scaling and Performance Optimization
- Replica scaling and load balancing: Scale backend replicas and verify traffic distribution across Pods.
- Baseline traffic generation: Use a simulator Pod to generate consistent chat traffic for realistic workload testing.
- Performance testing: Employ Apache Benchmark (AB) to evaluate latency and throughput under variable load.
- Metric collection: Collect pod-level metrics via Prometheus Operator components.
- Resource tuning: Adjust CPU and memory limits to analyze throttling effects and optimize response times.
- Visualization: Configured Grafana dashboards to monitor CPU utilization and replica performance.
CONTAINERS AND BASE IMAGES
| Container | Base Image | Download Link |
|---|---|---|
| Backend (chat-backend) | node:18-alpine |
https://hub.docker.com/_/node |
| Frontend (chat-frontend) | node:18-alpine, nginx:alpine |
Node: https://hub.docker.com/_/node, Nginx: https://hub.docker.com/_/nginx |
| Simulator (chat-simulator) | node:18-alpine |
https://hub.docker.com/_/node |
| Prometheus | prom/prometheus:latest |
https://hub.docker.com/r/prom/prometheus |
| Grafana | grafana/grafana:latest |
https://hub.docker.com/r/grafana/grafana |
| Metrics Server (Kubernetes Add-on) | N/A | https://github.com/kubernetes-sigs/metrics-server |
OTHER SOFTWARE INVOLVED
- Docker: Used to containerize the frontend, backend, and simulator components, ensuring portability and consistent runtime environments across systems.
- Docker Compose: Handled multi-container orchestration during the containerization phase, simplifying service linking and startup order management.
- Kubernetes (Minikube): Provided a local Kubernetes cluster for deploying and managing the chat application, offering scalability, self-healing, and rolling updates.
- Helm: Used to install and manage complex Kubernetes applications like Prometheus Operator through pre-configured Helm charts.
- Prometheus: Collected and stored system and application-level metrics, enabling real-time monitoring of resource usage and performance.
- Grafana: Visualized Prometheus metrics through interactive dashboards, helping analyze CPU utilization, latency, and overall application health.
- Apache Benchmark (AB): Used for load testing and performance evaluation, measuring latency, throughput, and error rates under simulated workloads.
- Metrics Server: Kubernetes add-on that provided resource usage metrics (CPU and memory) for Pods, enabling performance analysis and autoscaling decisions.
- Node.js: Served as the runtime environment for both backend and simulator components, handling API requests and traffic simulation efficiently.
- React.js: Used for building the interactive frontend chat interface, delivering real-time updates and seamless user experience.
SYSTEM ARCHITECTURE
Containerization and Resilience
Figure 1: Docker Compose architecture illustrating isolated frontend and backend containers communicating through an internal bridge network with automatic restart policies for fault tolerance.
The system was containerized using Docker to ensure portability, isolation, and consistent performance across environments. Each major component—frontend, backend, and database—was encapsulated within its own container, while Docker Compose orchestrated these services, managing dependencies and inter-container communication through a shared bridge network. The backend served API traffic on port 5001, and the frontend exposed the web interface on port 5173, with configuration variables securely managed via environment settings.
To enhance reliability, a restart: always policy was applied to all containers, allowing automatic recovery from process failures. Resilience was validated by intentionally terminating backend processes, after which Docker successfully restarted the service without disrupting frontend operations. This confirmed the architecture’s self-healing capability and established a reproducible, isolated foundation ready for Kubernetes-based orchestration and scaling.
Automation and Monitoring Stack Setup
Figure 2: Kubernetes-based automation and dual-layer monitoring architecture integrating Prometheus, Grafana, and load-testing components.
The containerized chat application was deployed on a Kubernetes Minikube cluster to enable scalable, automated, and fault-tolerant operation. A dedicated namespace chat-app isolated all related resources, including Deployments, Services, and Secrets. The frontend was exposed via a NodePort Service (:5173), while the backend ran as a multi-replica Deployment behind a ClusterIP Service (:5001) for internal communication. A Chat Simulator Pod continuously generated baseline traffic to emulate real-world usage, and an Apache Benchmark job injected high-intensity requests to test performance under stress. Kubernetes automatically balanced load across backend replicas and ensured continuous availability through rolling updates and self-healing mechanisms.
Monitoring and performance observability were achieved using a dual-layer architecture. The in-app Prometheus instance collected chat-specific metrics from the backend’s /metrics endpoint and visualized them in Grafana dashboards, displaying real-time throughput and latency trends. Parallelly, a Prometheus Operator setup installed via Helm managed cluster-level monitoring, integrating metrics-server and kube-state-metrics to track node and Pod resource utilization. These metrics were aggregated in a second Grafana instance for infrastructure insights. Together, this two-tier monitoring stack provided unified visibility into both application behavior and system performance, enabling dynamic scaling, proactive issue detection, and data-driven optimization.
PROCEDURES
Procedure – Part 1: Containerization and Resilience
The first stage of this project focused on building a self-contained, portable environment using Docker. The goal was to package the frontend, backend, and simulator services into independent containers and orchestrate them through Docker Compose, enabling seamless communication, scalability, and recovery from failures.
Step 1: Building the Docker Images
- Frontend: A React application built using a multi-stage Dockerfile, first compiled with Node.js and then served via Nginx on port 80.
- Simulator: A Node-based load generation script that continuously sends simulated user requests to the backend API.
- Each component of the application was containerized using its own Dockerfile.
- Backend: A Node.js Express API containerized with all dependencies and exposed on port 5001.
All Docker images were built using the following command:
docker-compose build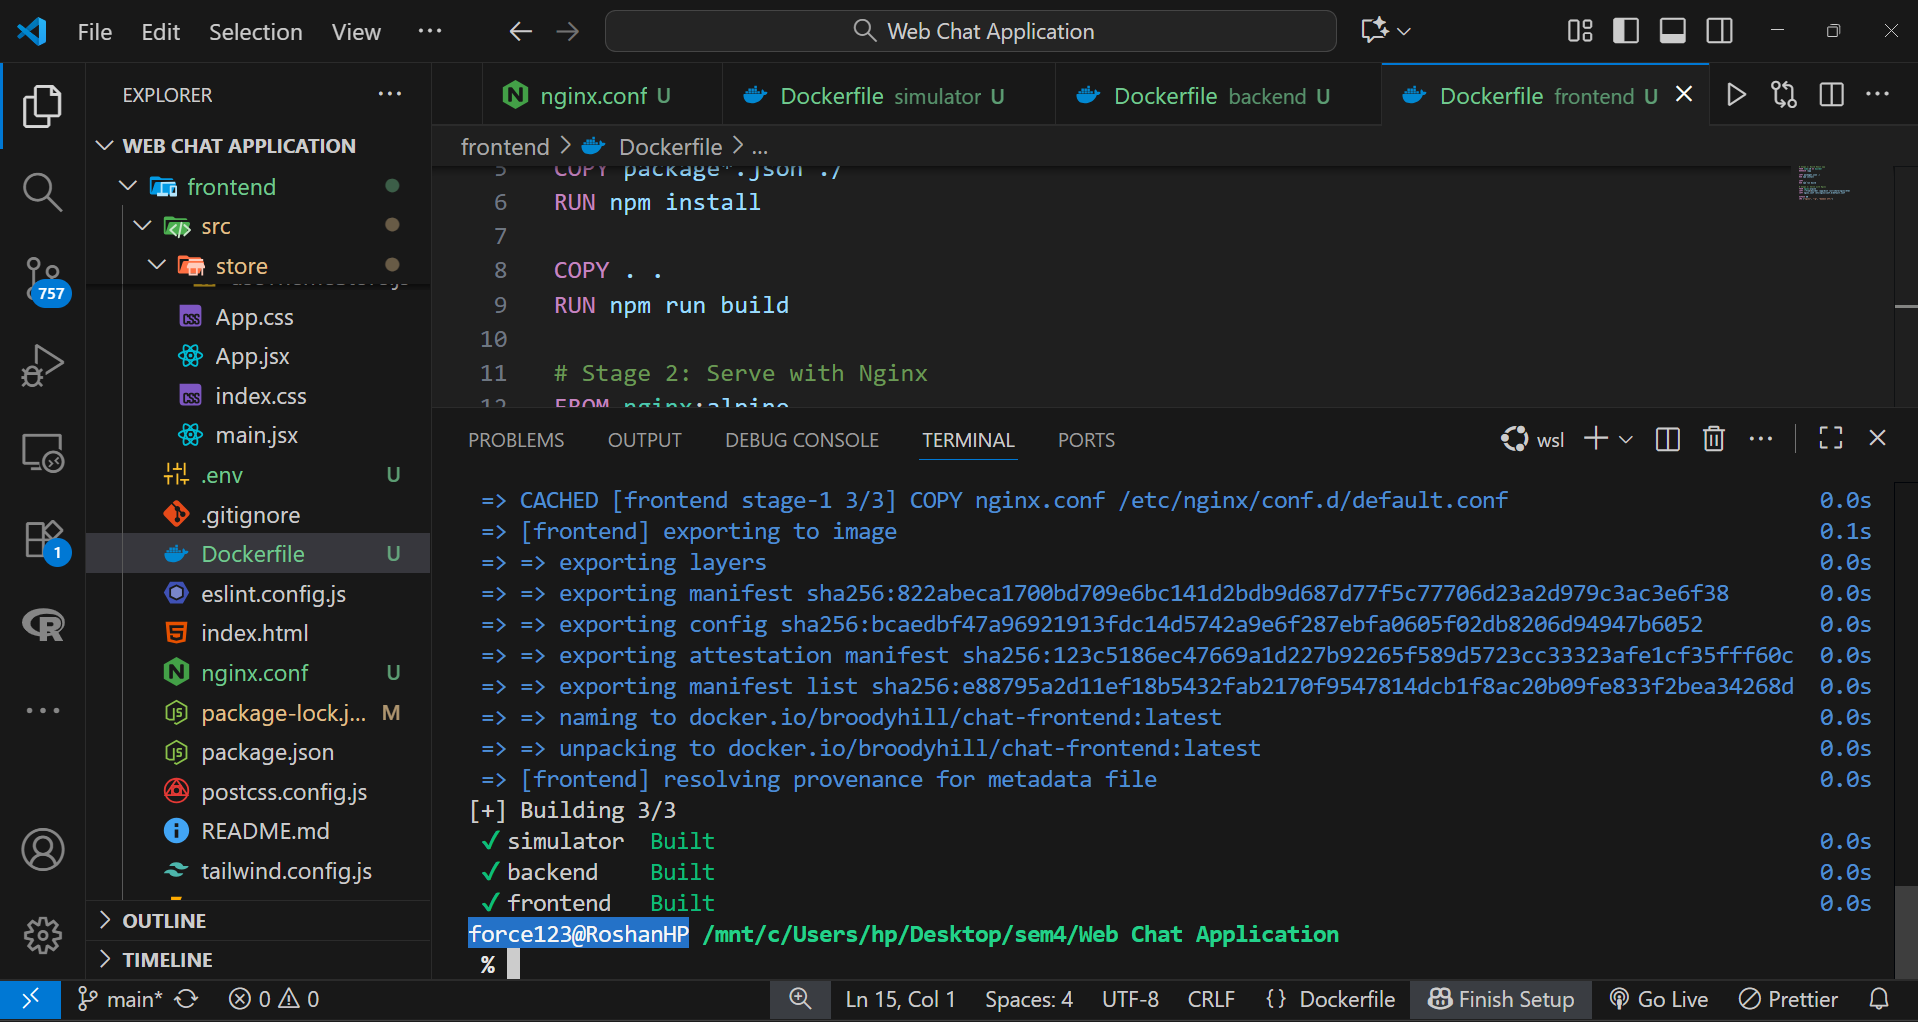
Step 2: Defining the Multi-Container Setup
The docker-compose.yml file defined how the containers interact, their dependencies, environment variables, and restart behavior.
Key highlights:
- The frontend depends on the backend, ensuring proper startup order.
- Prometheus and Grafana services were added to provide observability and performance metrics.
- The
restart: alwayspolicy ensures containers automatically recover after unexpected failures.
version: "3.9"

services:
  backend:
    build:
      context: ./backend
    image: broodyhill/chat-backend:latest
    container_name: chat-backend-container
    ports:
      - "5001:5001"
    volumes:
      - ./backend:/app
    environment:
      - PORT=5001
      - NODE_ENV=development
      - MONGODB_URI=${MONGODB_URI}
      - JWT_SECRET=${JWT_SECRET}
      - OPENROUTER_API_KEY=${OPENROUTER_API_KEY}
      - CLOUDINARY_CLOUD_NAME=${CLOUDINARY_CLOUD_NAME}
      - CLOUDINARY_API_KEY=${CLOUDINARY_API_KEY}
      - CLOUDINARY_API_SECRET=${CLOUDINARY_API_SECRET}
    restart: always

  frontend:
    build:
      context: ./frontend
    image: broodyhill/chat-frontend:latest
    container_name: chat-frontend-container
    ports:
      - "5173:80"
    depends_on:
      - backend
    volumes:
      - ./frontend:/app
    restart: always

  prometheus:
    image: prom/prometheus:latest
    container_name: prometheus
    volumes:
      - ./prometheus/prometheus.yml:/etc/prometheus/prometheus.yml
    ports:
      - "9090:9090"
    restart: always
    depends_on:
      - backend

  grafana:
    image: grafana/grafana:latest
    container_name: grafana
    environment:
      GF_SECURITY_ADMIN_PASSWORD: your_password_here
    ports:
      - "3000:3000"
    depends_on:
      - prometheus
    restart: always

  simulator:
    build:
      context: ./simulator
    image: broodyhill/chat-simulator:latest
    container_name: chat-simulator
    environment:
      - NUM_USERS=200
      - SERVER_URL=http://backend:5001
    depends_on:
      - backend
    restart: always
Step 3: Launching the Services
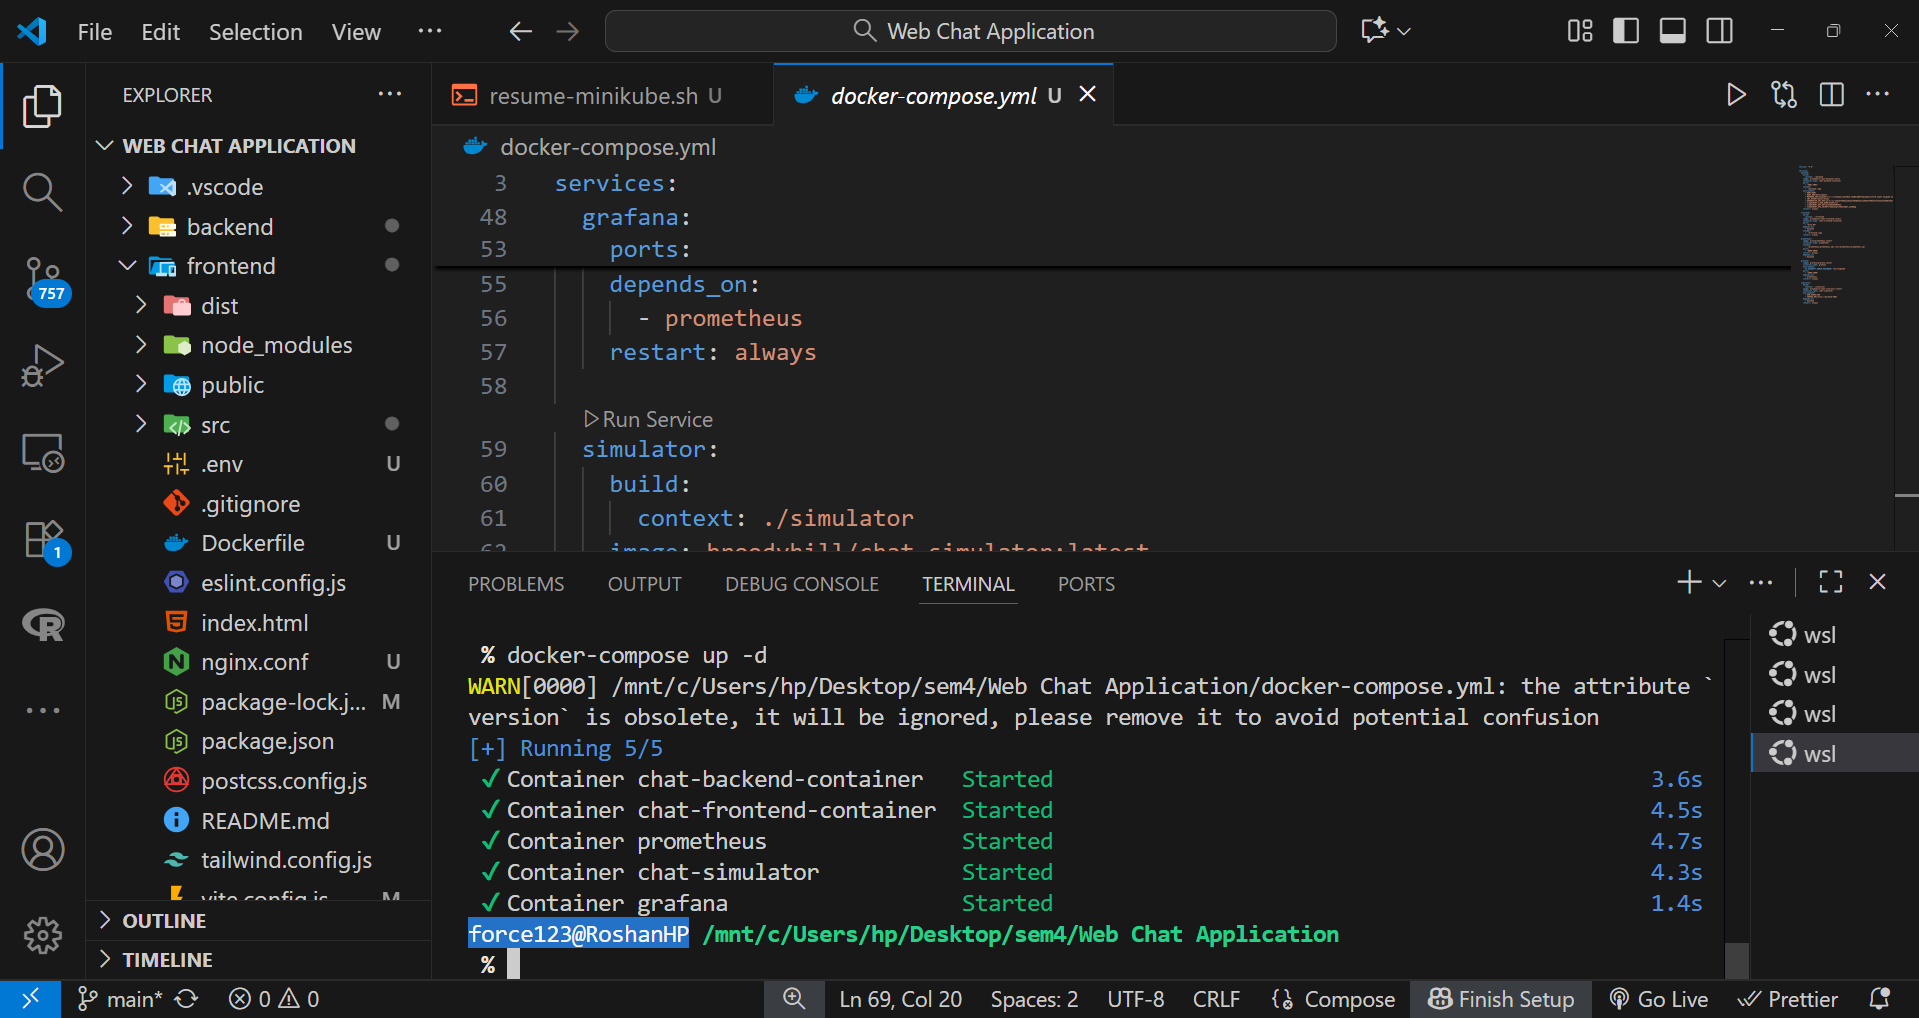
After configurations were finalized, all containers were launched using:
docker-compose up -dThis command started every service in detached mode, allowing background execution and internal networking through Docker’s bridge network.
The frontend was accessible at http://localhost:5173 and the backend API ran on http://localhost:5001.
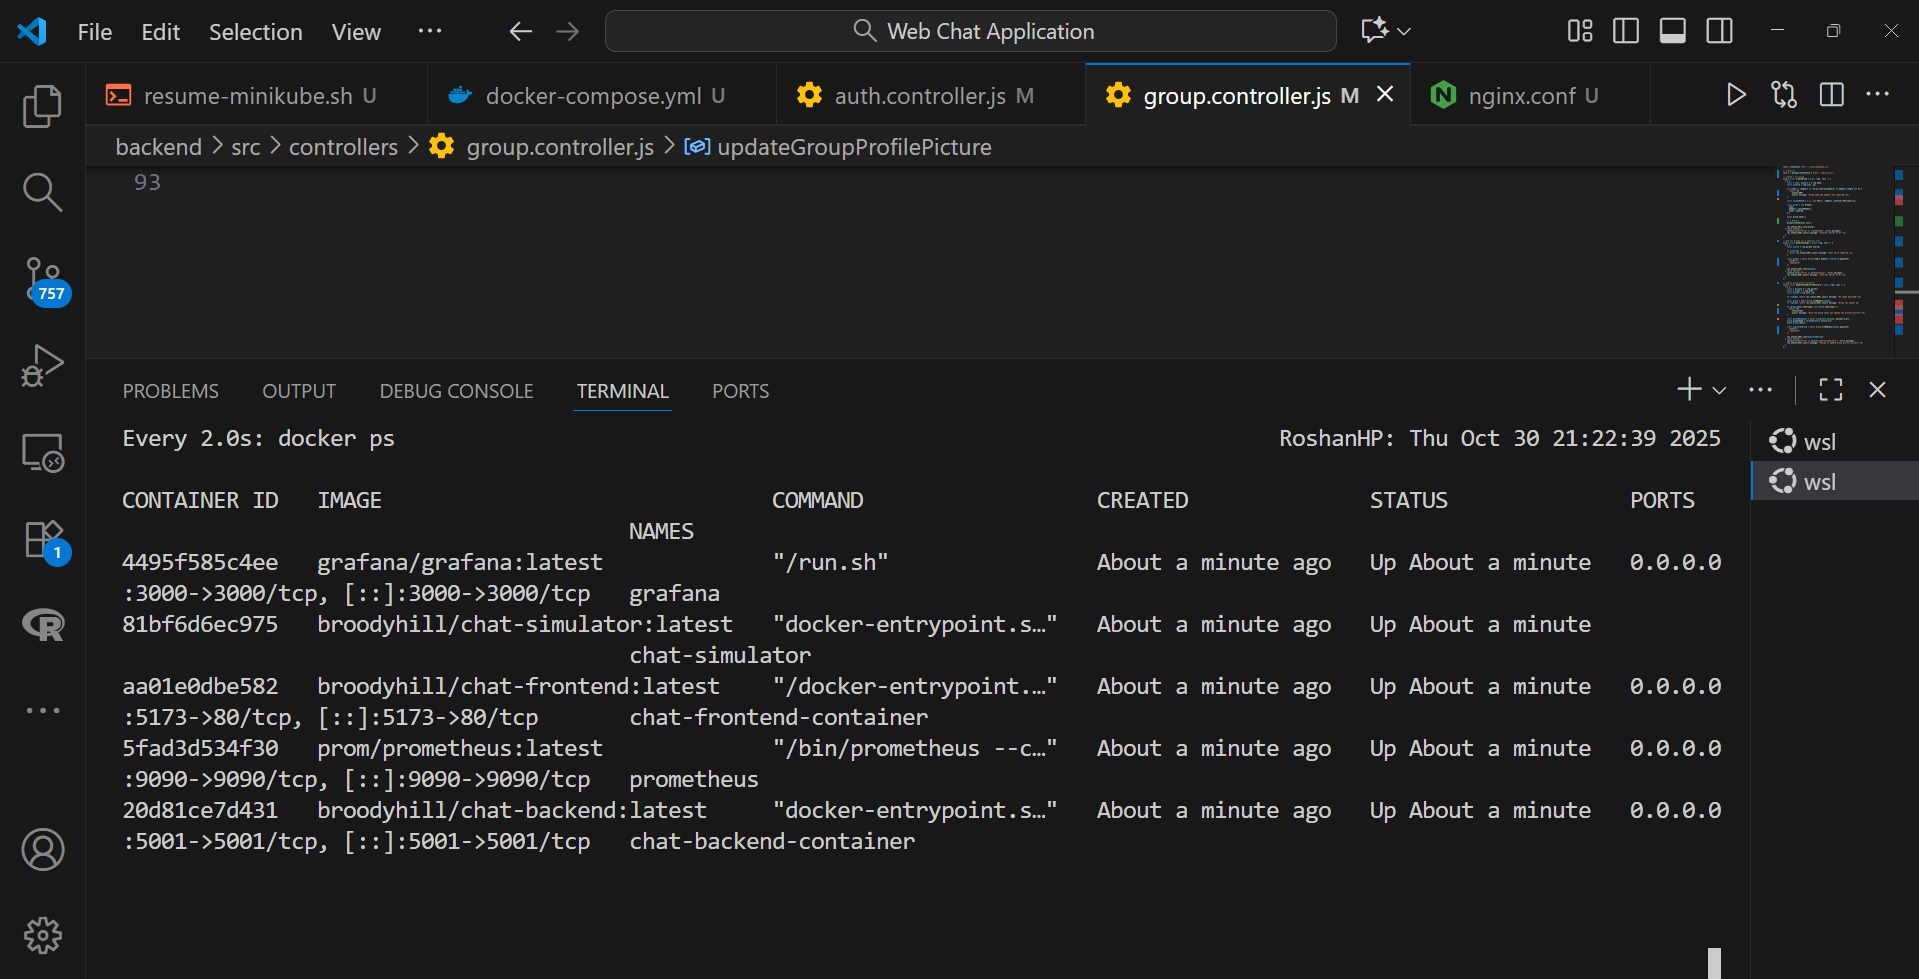
Step 4: Verifying Resilience and Auto-Restart
To verify resilience, the command watch docker ps was used in a WSL terminal to monitor the container status.
The backend process was intentionally stopped inside the running container:
docker exec -it chat-backend-container bash
kill 1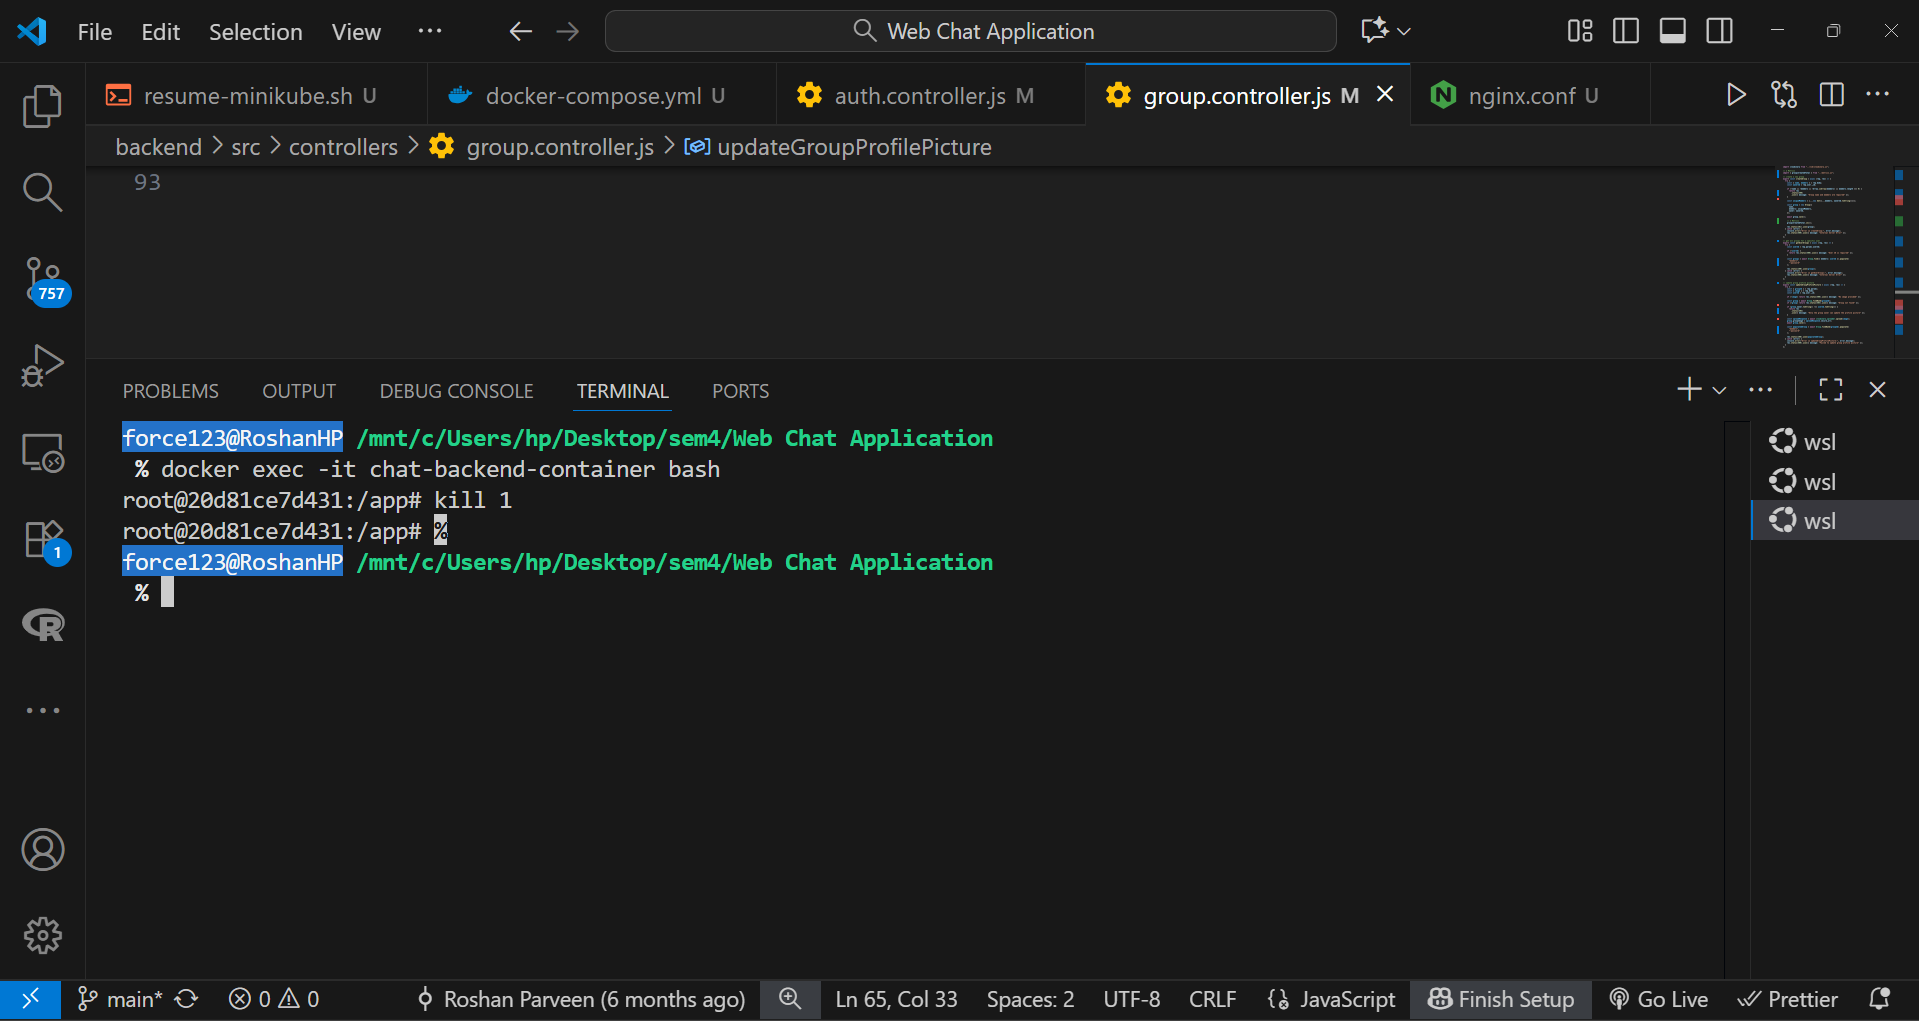
Within seconds, Docker’s restart policy automatically restarted the backend container, ensuring uninterrupted service. During this test, the frontend chat interface remained responsive, confirming fault tolerance and seamless reconnection.

Procedure – Part 2: Kubernetes Orchestration and Monitoring
The second stage of this project focused on deploying the chat application within a Kubernetes environment using Minikube. The objective was to achieve automated environment setup, efficient resource management, and integrated monitoring through Prometheus Operator.
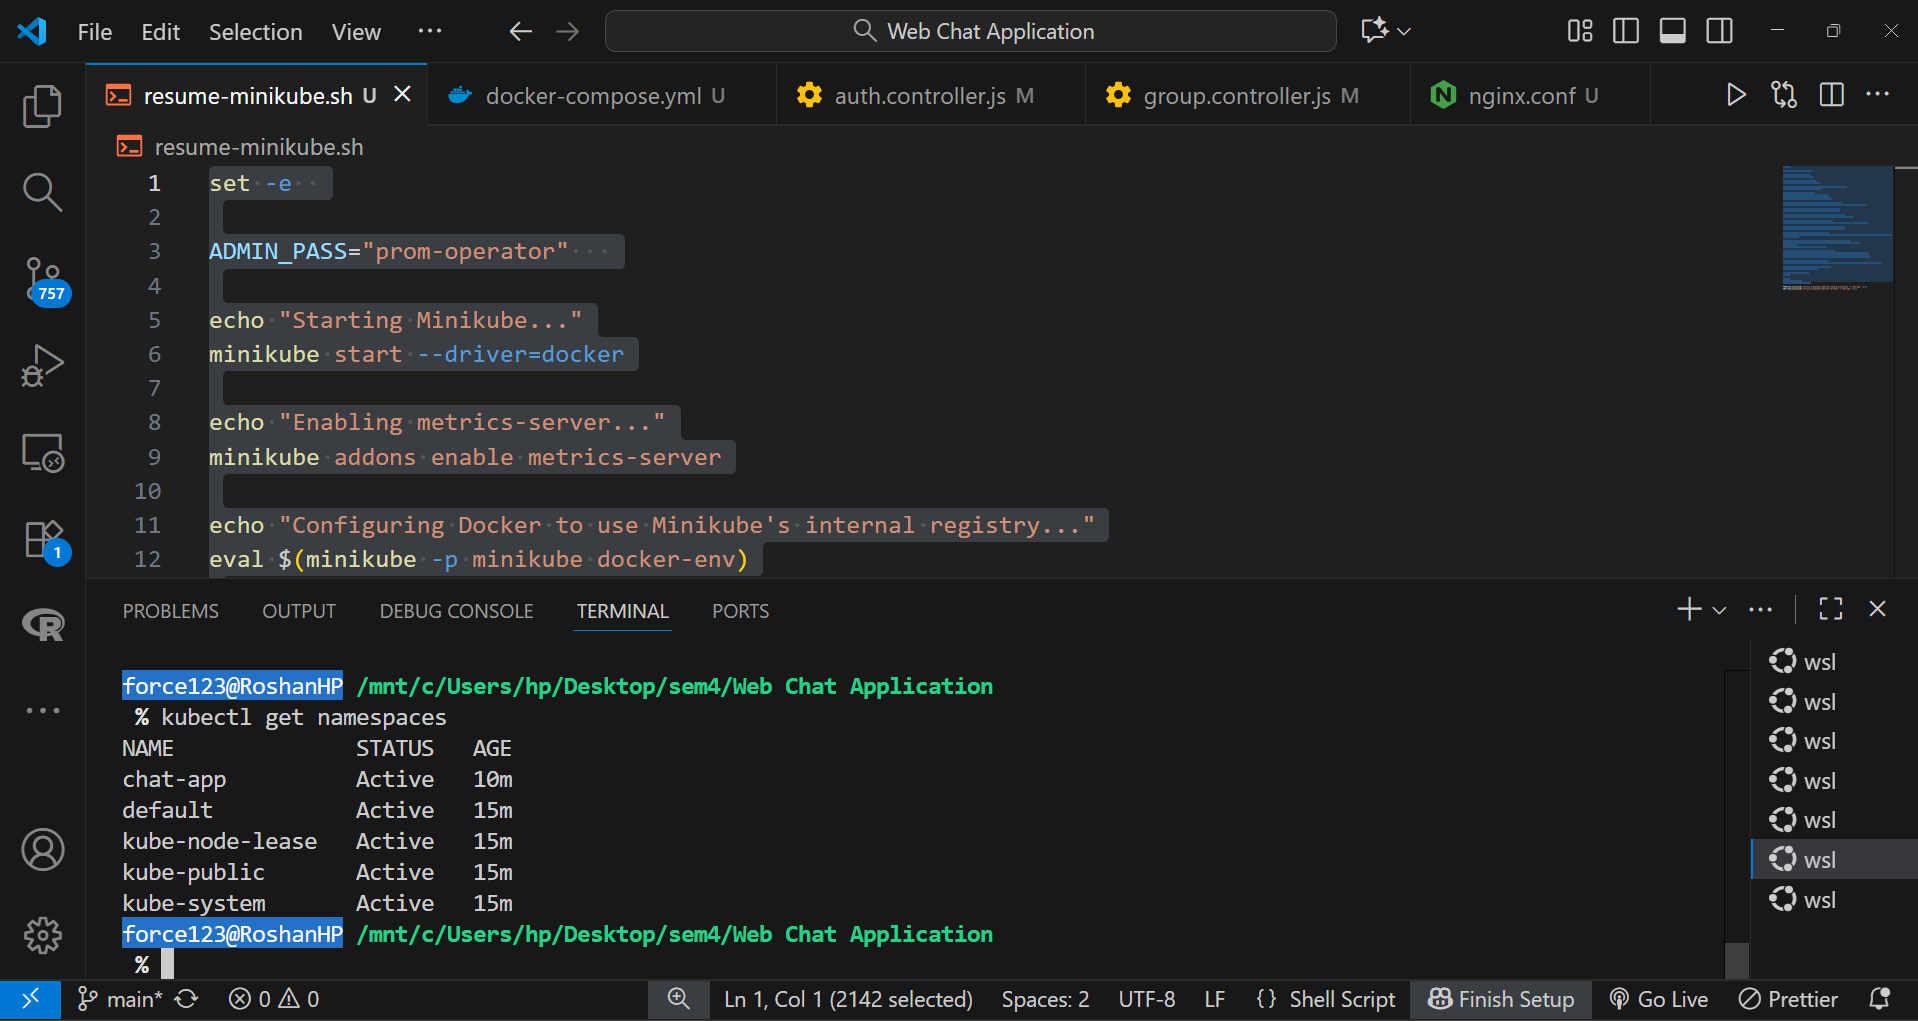
Step 1: Automating the Cluster Setup
A shell script was created to automate the initialization of the Minikube cluster. This script performed the following actions sequentially:
- Started Minikube with sufficient resource allocation for all services.
- Enabled the
metrics-serveradd-on to gather real-time resource utilization metrics. - Executed internal Docker image builds within Minikube’s Docker environment to avoid external image pushes.
This ensured a fully automated and reproducible cluster setup with minimal manual intervention.
set -e
ADMIN_PASS="prom-operator"
echo "Starting Minikube..."
minikube start --driver=docker
echo "Enabling metrics-server..."
minikube addons enable metrics-server
echo "Configuring Docker to use Minikube's internal registry..."
eval $(minikube -p minikube docker-env)
echo "Building Docker images..."
docker build -t chat-backend:latest ./backend
docker build -t chat-frontend:latest ./frontend
docker build -t chat-simulator:latest ./simulator
echo "Creating namespace 'chat-app' if it doesn't exist..."
kubectl get namespace chat-app >/dev/null 2>&1 || kubectl create namespace chat-app
echo "Setting kubectl context to namespace 'chat-app'..."
kubectl config set-context --current --namespace=chat-app
echo "Cleaning old Prometheus/Grafana Helm releases if any..."
helm uninstall prometheus-operator -n chat-app >/dev/null 2>&1 || true
echo "Deleting old Grafana secret if it exists..."
kubectl delete secret prometheus-operator-grafana -n chat-app >/dev/null 2>&1 || true
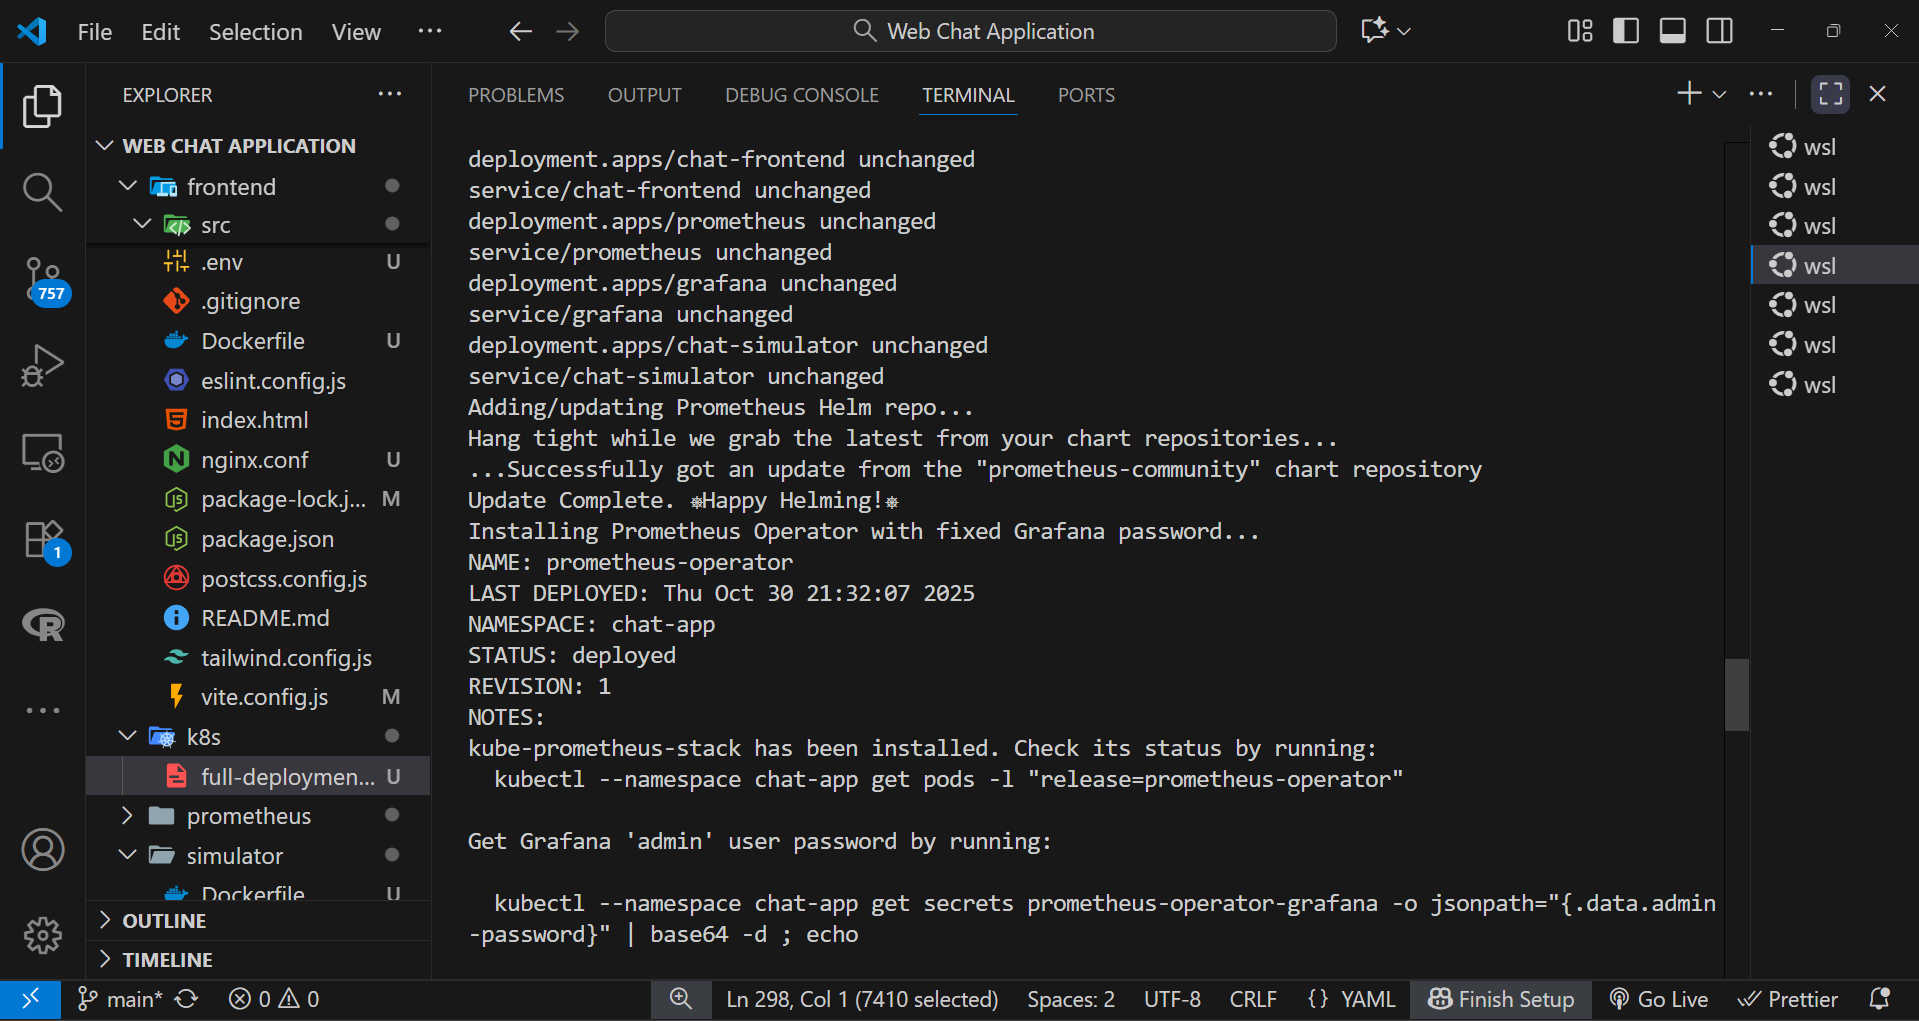
echo "Applying app deployments only (no manual Prometheus)..."
kubectl apply -f k8s/full-deployment.yaml -l 'app!=prometheus'
echo "Adding/updating Prometheus Helm repo..."
helm repo add prometheus-community https://prometheus-community.github.io/helm-charts >/dev/null 2>&1 || true
helm repo update
echo "Installing Prometheus Operator with fixed Grafana password..."
helm install prometheus-operator prometheus-community/kube-prometheus-stack \
-n chat-app \
--set grafana.adminPassword="$ADMIN_PASS"
echo "Waiting for critical app pods to be ready..."
kubectl wait --for=condition=ready pod -l app=chat-backend -n chat-app --timeout=180s
kubectl wait --for=condition=ready pod -l app=chat-frontend -n chat-app --timeout=180s
kubectl wait --for=condition=ready pod -l app=chat-simulator -n chat-app --timeout=180s
echo "Waiting for Grafana pod to be ready..."
kubectl wait --for=condition=ready pod -l app.kubernetes.io/name=grafana -n chat-app --timeout=180s
echo "Starting minikube tunnel in background..."
(minikube tunnel >/dev/null 2>&1 &)
#few seconds to initialize
sleep 5
echo ""
echo "Pods status:"
kubectl get pods -n chat-appStep 2: Creating an Isolated Namespace
To maintain logical separation between system and application resources, a dedicated namespace named chat-app was created. All deployments, services, and monitoring components were configured to operate within this namespace.
kubectl create namespace chat-appThis approach improved manageability and made the cleanup process straightforward.
Step 3: Deploying the Application Components
Frontend, backend, and simulator services were deployed using Kubernetes Deployment manifests. These deployments defined replica counts, resource requests and limits, and rolling update strategies. This ensured that Pods could be updated without downtime, and failed instances were automatically replaced by the ReplicaSet controller.
Step 4: Configuring Networking through Services
Internal service communication was handled using ClusterIP type Services, allowing the frontend and backend Pods to interact securely within the cluster. For external access via Minikube, a NodePort Service was configured for the frontend, exposing it to the host system.
This combination allowed both internal traffic routing and user accessibility without complex ingress setup.
# Backend Service - internal communication within cluster
apiVersion: v1
kind: Service
metadata:
  name: chat-backend
  namespace: chat-app
spec:
  selector:
    app: chat-backend
  ports:
    - protocol: TCP
      port: 5001
      targetPort: 5001
  type: ClusterIP

# Frontend Service - exposed externally via NodePort
apiVersion: v1
kind: Service
metadata:
  name: chat-frontend
  namespace: chat-app
spec:
  selector:
    app: chat-frontend
  ports:
    - protocol: TCP
      port: 80
      targetPort: 80
      nodePort: 30001
  type: NodePort
Step 5: Setting Up Monitoring with Helm
Prometheus Operator was installed using Helm for efficient monitoring and alerting setup. Helm simplified the deployment of complex resource configurations by managing multiple manifests as a single chart.
Commands used:
helm repo add prometheus-community https://prometheus-community.github.io/helm-charts
helm install prometheus prometheus-community/kube-prometheus-stack --namespace chat-app
This provided real-time visualization of cluster and application metrics through Prometheus and Grafana dashboards.
Step 6: Synchronizing Startup and Tunnel Access
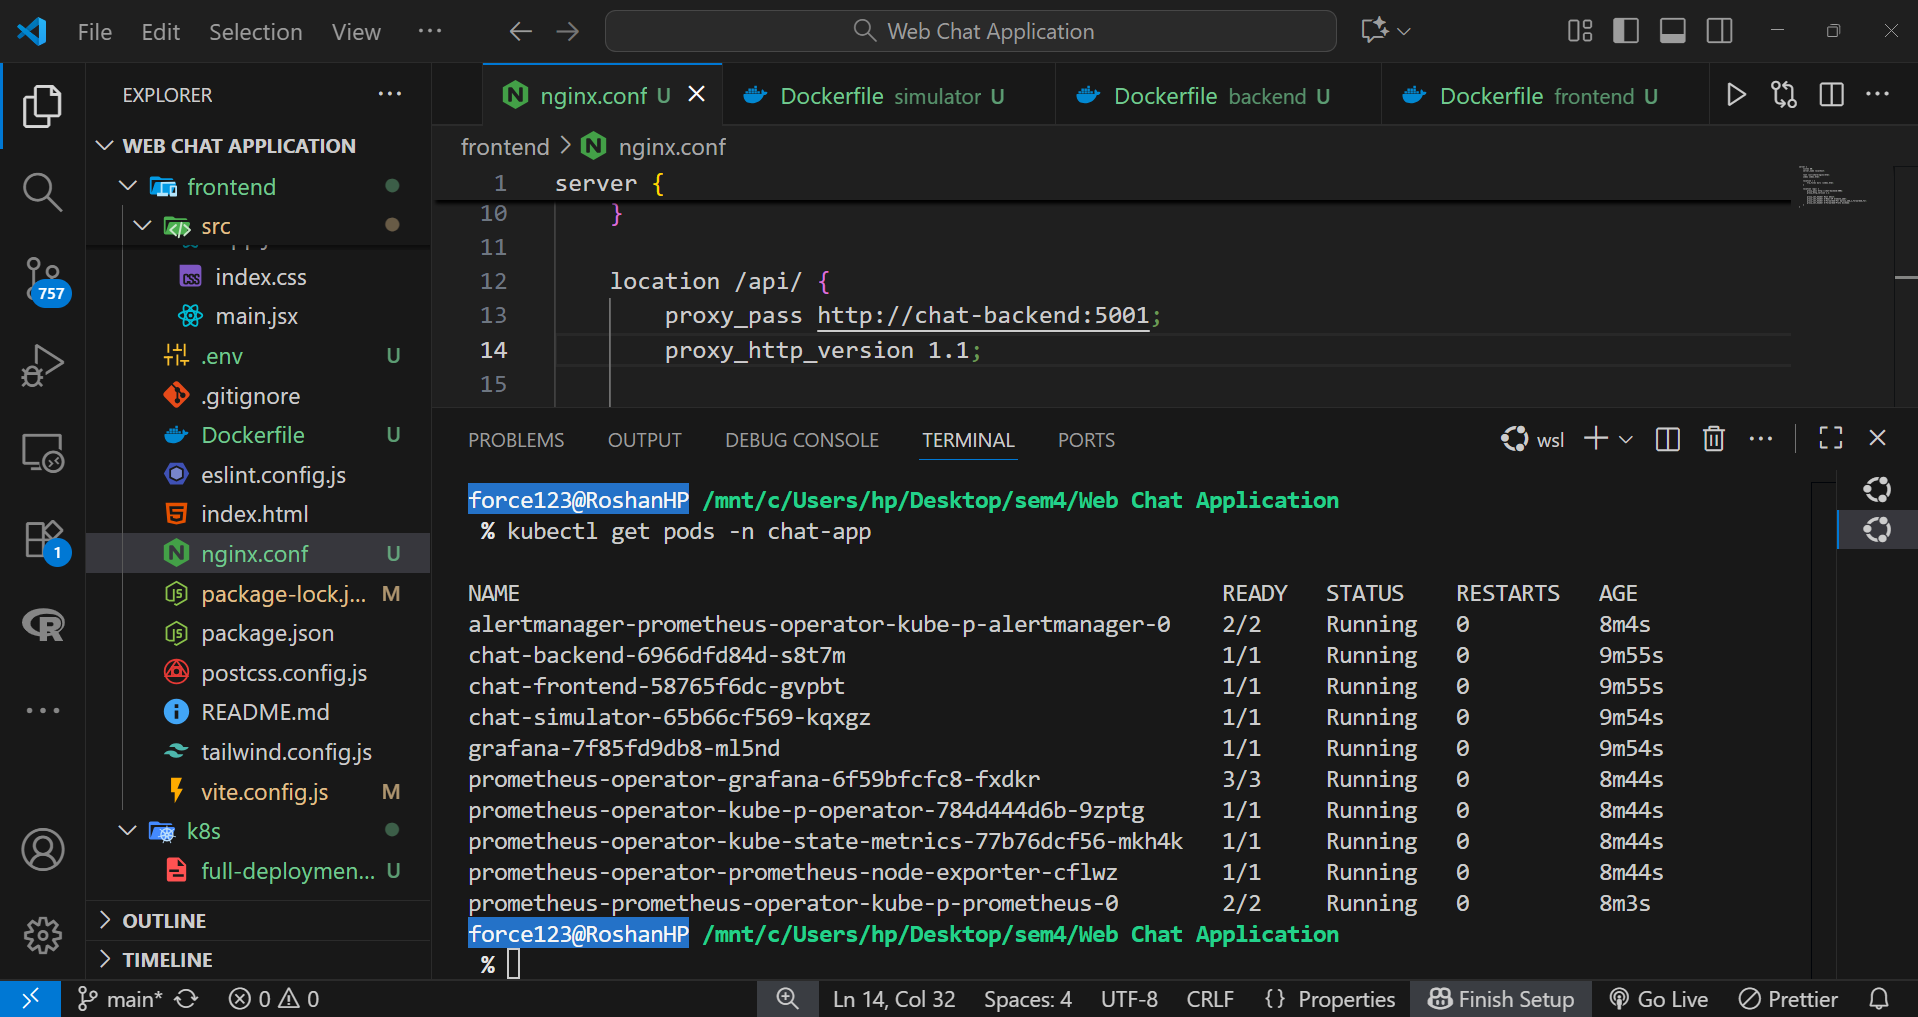
Once all components were deployed, Pod readiness was verified using:
kubectl get pods -n chat-appAfter confirming all Pods were in Running state, a background Minikube tunnel was launched to enable stable external routing to the NodePort service. The tunnel ensured consistent network connectivity, allowing external users to access the frontend application seamlessly.
This stage successfully demonstrated the power of Kubernetes orchestration, including automated scaling, rolling updates, monitoring integration, and resilience within a self-contained Minikube environment.
Procedure – Part 3: Monitoring, Scaling, and Performance Optimization
The third stage of the project focused on evaluating the scalability and performance of the chat application within the Kubernetes environment. The goal was to measure system behavior under load, optimize resource usage, and visualize metrics through Prometheus and Grafana dashboards.
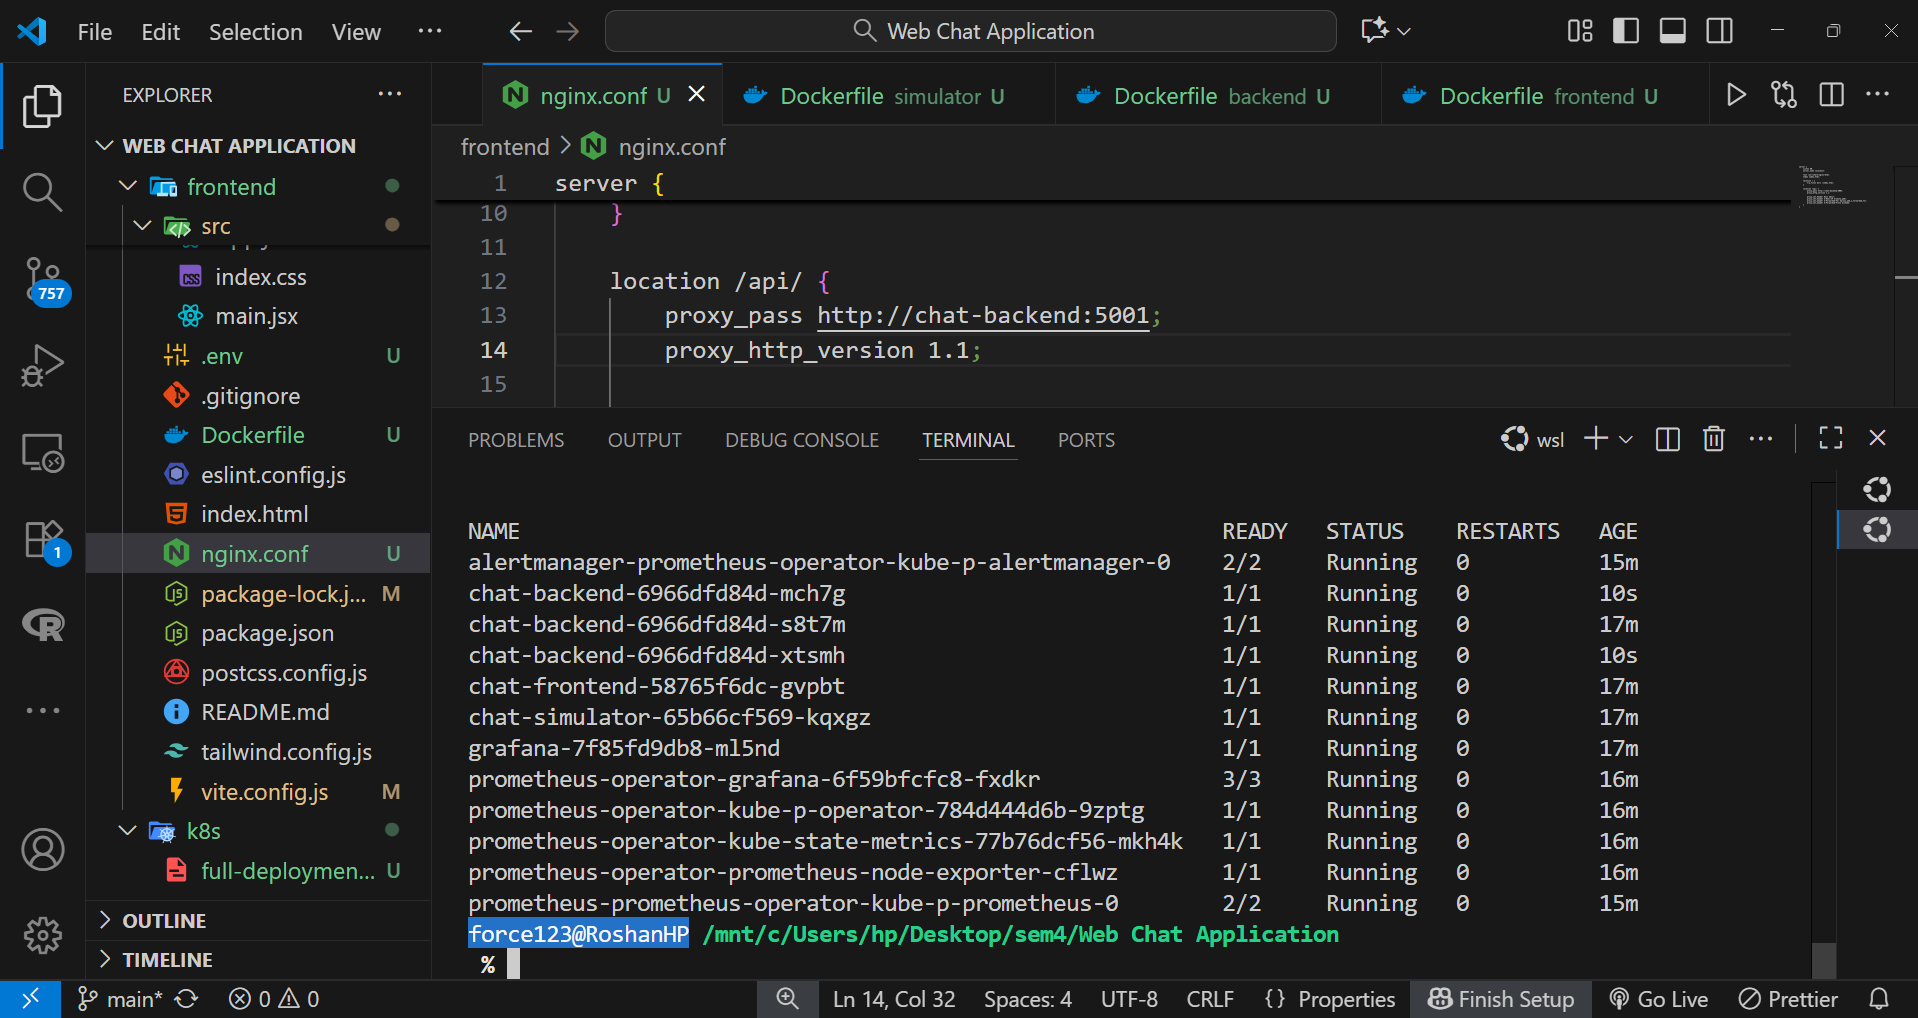
Step 1: Scaling Backend Replicas and Load Balancing
The backend Deployment was scaled horizontally to handle higher concurrent traffic and ensure even load distribution across Pods.
kubectl scale deployment backend-deployment --replicas=3 -n chat-appKubernetes Service automatically performed round-robin load balancing between the backend Pods, maintaining stable response times under moderate load.
Step 2: Generating Baseline Traffic
A simulator Pod was deployed to generate steady chat traffic across the backend endpoints, simulating real-time user interactions. This approach provided consistent input data for testing response latency, throughput, and system resilience under continuous operation.
kubectl logs -f chat-simulator-65b66cf569-nk2nb -n chat-app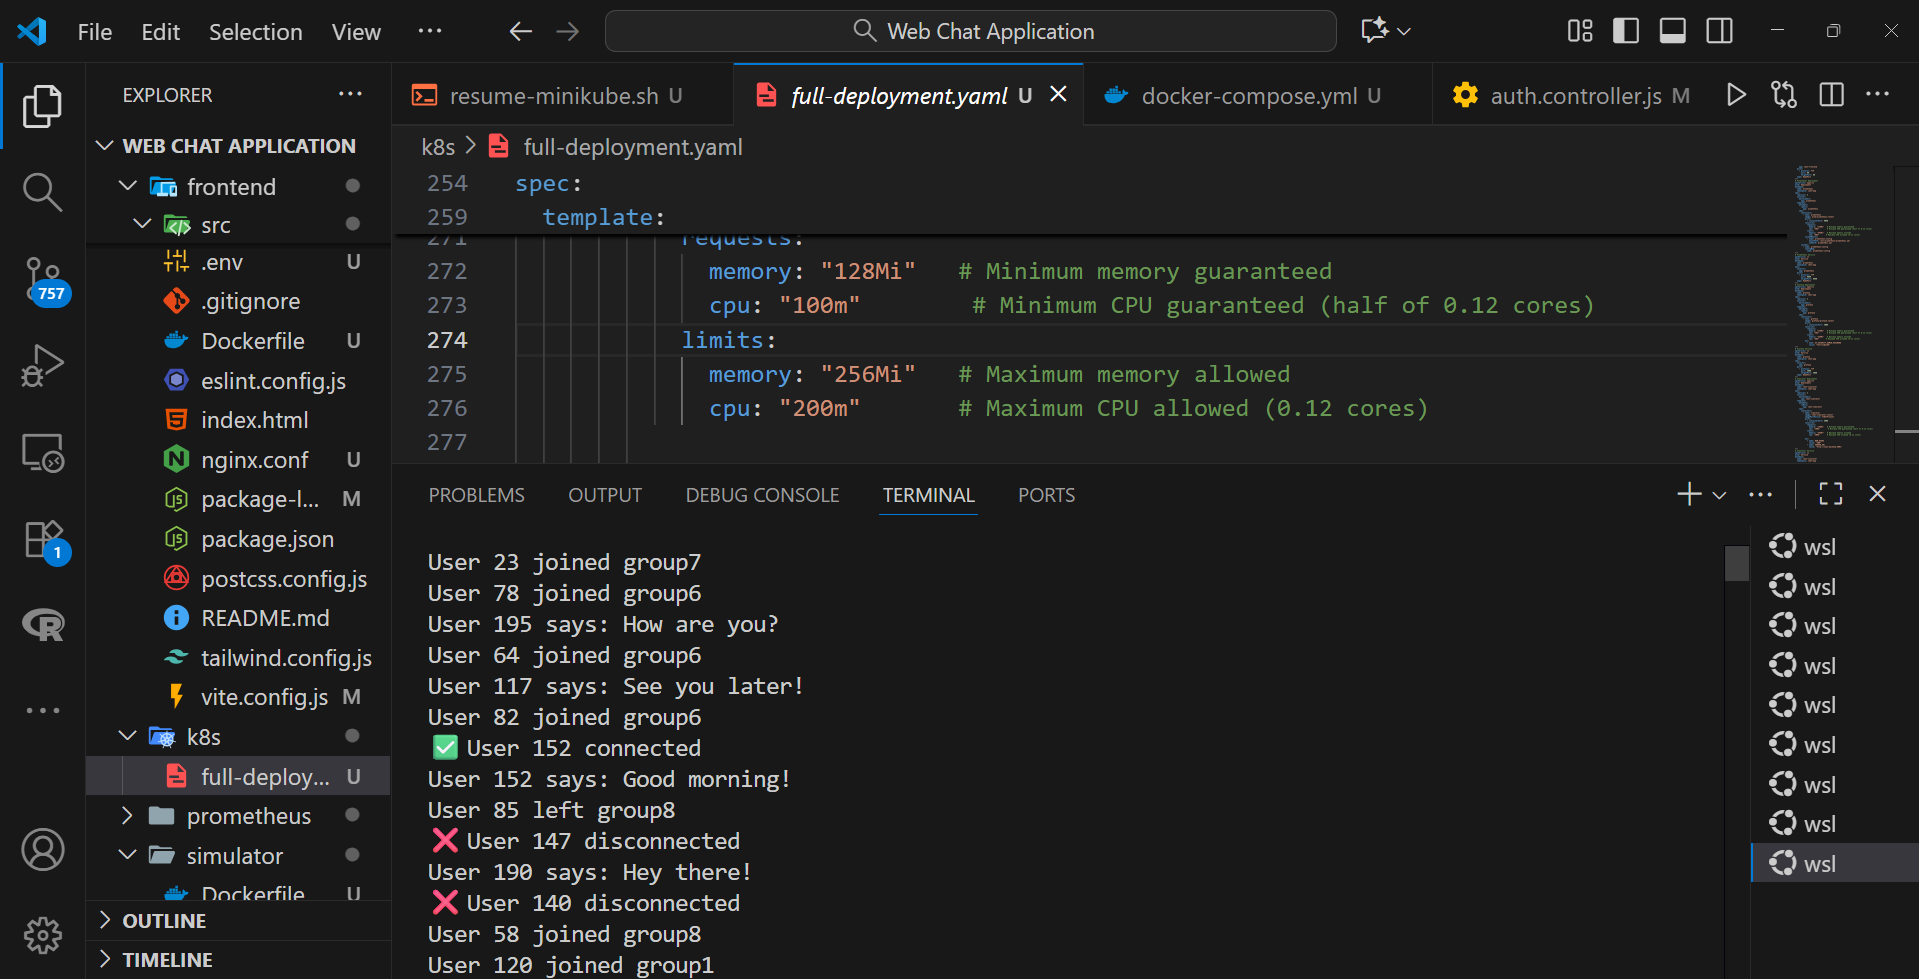
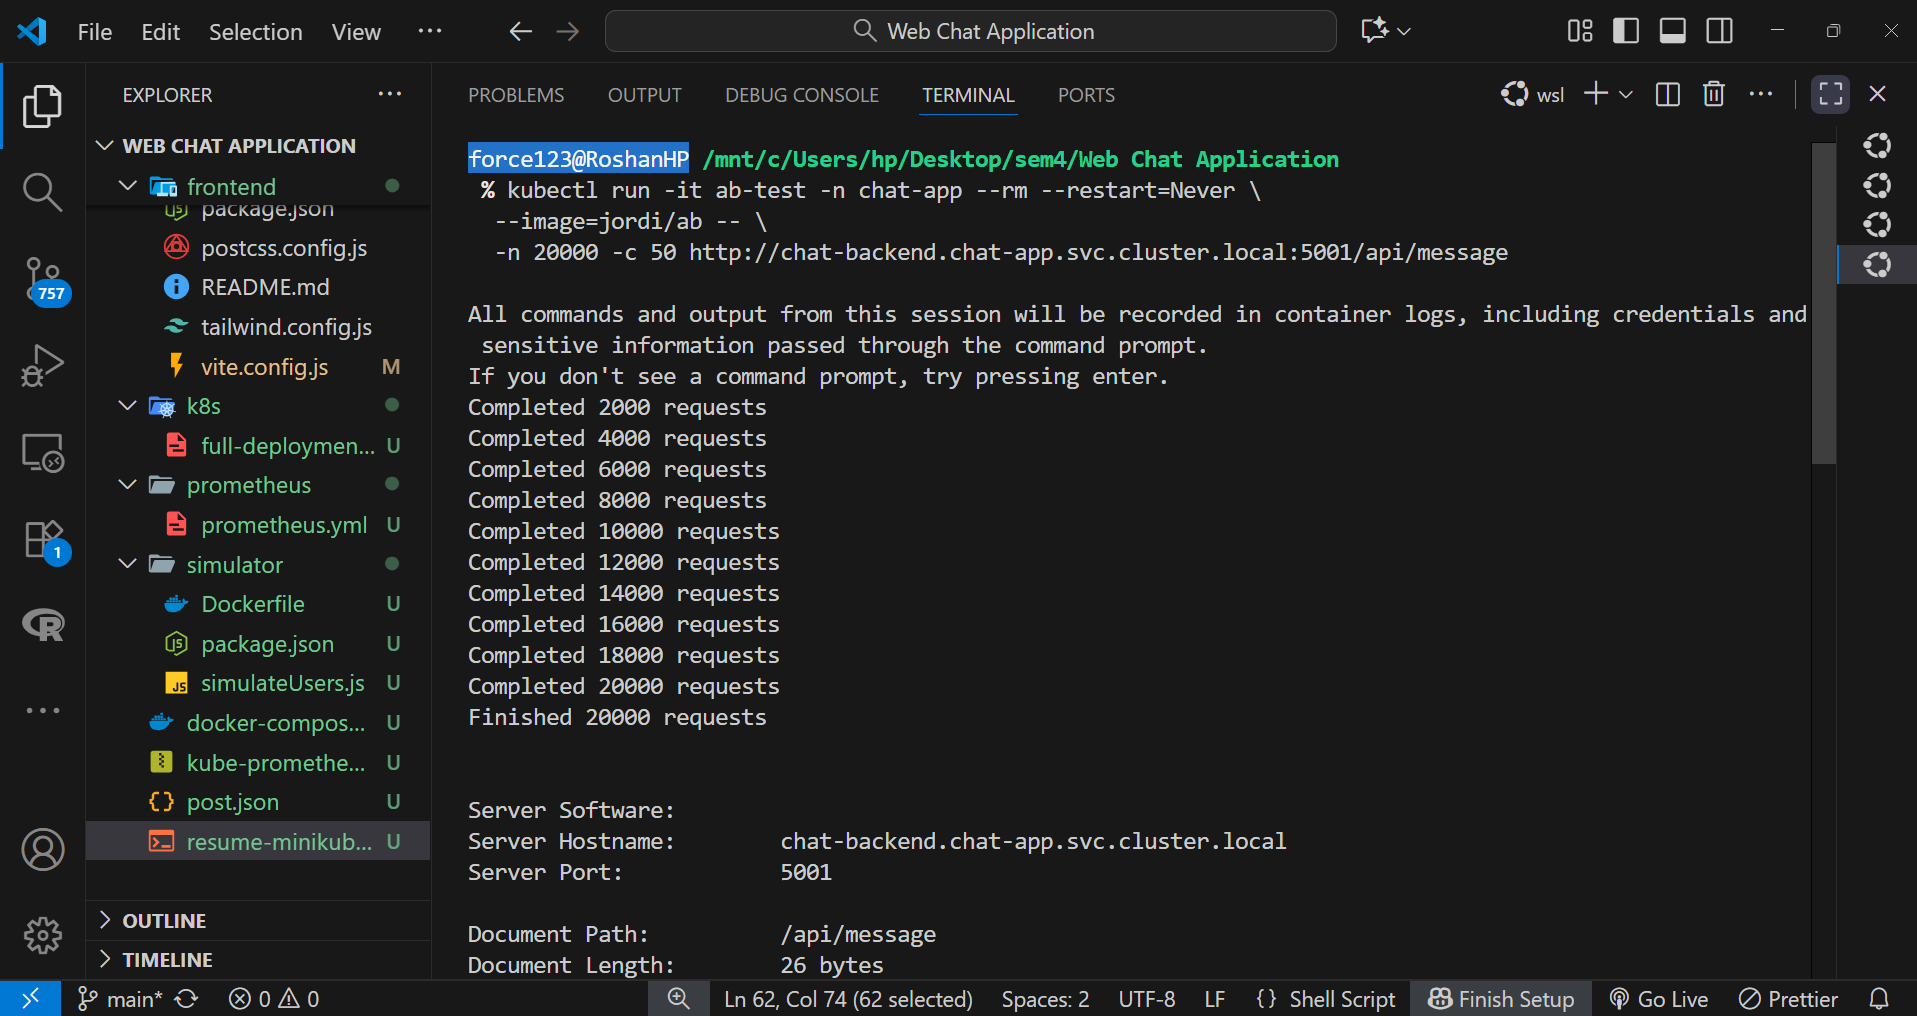
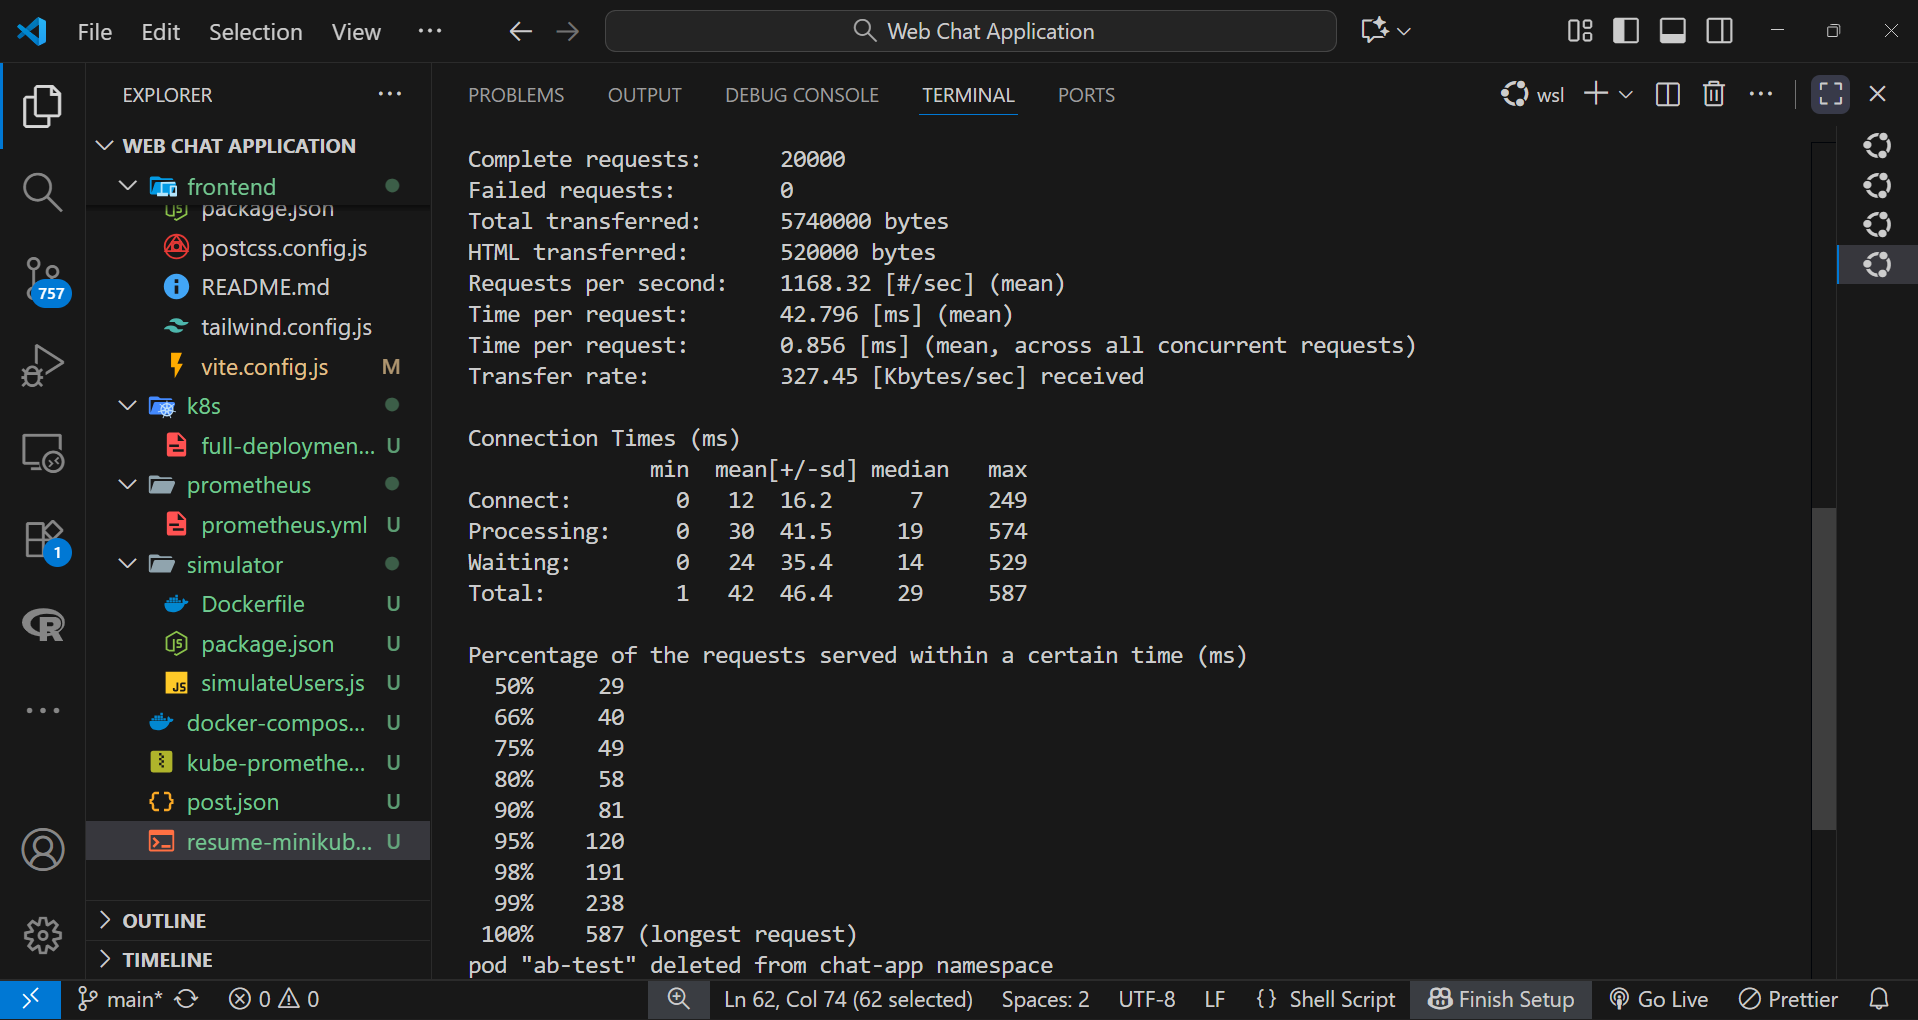
Step 3: Conducting Performance Testing
To quantify application performance, Apache Benchmark (AB) was used to simulate variable load conditions.
kubectl run -it ab-test -n chat-app --rm --restart=Never \
  --image=jordi/ab -- \
  -n 20000 -c 50 http://chat-backend.chat-app.svc.cluster.local:5001/api/message
The test captured metrics such as average response time, requests per second, and error rate, helping identify bottlenecks under concurrent access.
Step 4: Resource Tuning and Optimization
CPU and memory resource limits for backend Pods were fine-tuned in the Deployment manifest to test different configurations. By observing the effects of throttling and utilization patterns, optimal resource allocation was determined to minimize latency without overprovisioning.
Step 5: Visualizing Metrics in Grafana Dashboards
Grafana was configured to display key performance indicators in real time. Dashboards were designed to track CPU utilization, memory trends, average response latency, and replica-level performance. These visual insights helped validate scaling effectiveness and ensured system stability under varying workloads.
This stage validated the system’s ability to scale dynamically, maintain performance under pressure, and leverage observability tools for continuous optimization.

MODIFICATIONS MADE IN CONTAINERS
Backend Container
- Set the working directory to
/appso all file operations occur within this directory. - Copied
package*.jsonfiles into/appto enable dependency installation while taking advantage of Docker layer caching. - Ran
npm installto install the required Node.js dependencies inside the container. - Copied all source files into
/appso the backend application code is available. - Exposed port
5001to indicate that the backend server listens on that port. - Set the default command to run
node src/index.jsso the server starts automatically when the container runs.
Frontend Container
Builder stage (node:18):
- Defined the first stage as
builderto create the production build separately. - Set
WORKDIRto/appinside the builder stage. - Copied
package*.jsoninto/appto prepare for dependency installation. - Ran
npm installto install both development and build dependencies. - Copied the remaining project files into the container to make the source code available.
- Ran
npm run buildto generate optimized static files in/app/dist.
Final stage (nginx:alpine):
- Switched to
nginx:alpineas a lightweight web server for static files. - Copied the built files from
/app/distin the builder stage to/usr/share/nginx/html. - Copied a custom
nginx.confto/etc/nginx/conf.d/default.conffor application-specific routing and configuration. - Exposed port
80for HTTP access. - Set the default command to run nginx in the foreground using
nginx -g "daemon off;".
Simulator Container
- Set
WORKDIRto/appto organize simulator files in one location. - Copied
package*.jsonand rannpm installto install the dependencies required by the simulator script. - Copied
simulateUsers.jsinto the container so the simulator logic is available. - Set the default command to run
node simulateUsers.jsso the simulation begins when the container starts.
MODIFIED CONTAINERS
Backend (chat-backend)
Repository Link: https://hub.docker.com/repository/docker/broodyhill/chat-backend/general
Frontend (chat-frontend)
Repository Link: https://hub.docker.com/repository/docker/broodyhill/chat-frontend/general
Simulator (chat-simulator)
Repository Link: https://hub.docker.com/repository/docker/broodyhill/chat-simulator/general
OUTCOMES
- Successfully containerized the full-stack real-time web chat application into independent, reusable Docker images for the backend, frontend, and simulator.
- Implemented multi-container orchestration using Docker Compose, ensuring seamless inter-service communication and resilience through automatic restart policies.
- Integrated a monitoring stack using Prometheus and Grafana for real-time visualization of system and application metrics.
- Deployed the complete setup to a Kubernetes Minikube cluster using declarative manifests and Helm charts for Prometheus Operator.
- Verified high availability, performance stability, and automated recovery under simulated load conditions.
- Demonstrated end-to-end observability with resource utilization tracking, request latency visualization, and container-level health metrics.
CONCLUSION
The project successfully achieved the objective of creating a containerized, monitored, and resilient real-time web chat system. By leveraging Docker, Kubernetes, Prometheus, and Grafana, the solution demonstrated the key principles of cloud-native development: scalability, reliability, and transparency. This distributed architecture ensured smooth performance under load and showcased how DevOps tools can be integrated effectively to automate deployment, monitoring, and maintenance in modern microservice environments.
REFERENCES
Docker Hub Repositories – Original base images and references were obtained from the official Docker Hub sources:
- Node.js: https://hub.docker.com/_/node
- Nginx: https://hub.docker.com/_/nginx
- Prometheus: https://hub.docker.com/r/prom/prometheus
- Grafana: https://hub.docker.com/r/grafana/grafana
GitHub Source References – Base project ideas, Dockerfile structures, and Kubernetes configurations were inspired by publicly available open-source repositories and official documentation.
- Dockerized Real-Time Chat Application (original inspirations and structure references).
- Kubernetes Metrics Server: https://github.com/kubernetes-sigs/metrics-server
IIT Bombay Docker Tutorial – Conceptual understanding of containerization and orchestration was strengthened through the IIT Bombay “Docker for Beginners” tutorial.
Tutorial Link: https://spoken-tutorial.org/tutorial-search/?search_foss=Docker&search_language=English
ACKNOWLEDGMENT
This project was undertaken as part of the Digital Assignment (DA) for the Cloud Computing course in the fifth semester under the School of Computer Science and Engineering (SCOPE), Vellore Institute of Technology (VIT Chennai).
I wish to express my heartfelt gratitude to Dr. Subbulakshmi T., Faculty, School of Computer Science and Engineering (SCOPE), for her continuous guidance, encouragement, and valuable feedback throughout the course of this project. Her support and mentorship played a vital role in the successful completion of this work.
I would also like to acknowledge the open-source developer community for providing the frameworks, libraries, and documentation that enabled the efficient implementation of this Docker- and Kubernetes-based real-time monitoring system.
— Roshan Parveen
School of Computer Science and Engineering (SCOPE)
Vellore Institute of Technology (VIT), Chennai

Comments
Post a Comment